In this post, I’m going to discuss the statistics course I recently attended and my personal history with statistics and mathematics, as I think this is an area where many junior scientists, especially women, feel insecure. The course was with Highland Statistics: Introduction to mixed modelling and GLMM (frequentist & Bayesian approaches). It just so happened to be in Trondheim Norway. A week of statistics and gorgeous scenery, what could be better?
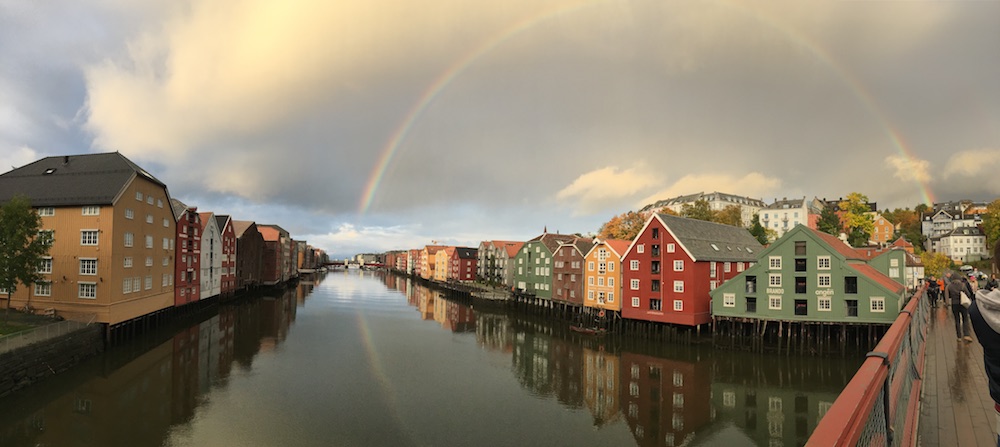
View from the Gamle Bybro. Such a stunning city!
The course was entirely in R, meant for those familiar with the platform and with linear regression. I fall into this category pretty safely, but was nervous because I haven’t received much formal statistical training.
My trepidation was the latest installment in a long history of feeling like I’m not good at math. My mathematical education has had its ups and downs. When I was younger, I often mixed up numbers and I came up with my own method for long division, which no one could convince me was incorrect. Suffice it to say, I did not distinguish myself in my math classes or on national tests.
I started to improve with Algebra, as numbers were replaced with letters, and peaked with a 5/5 on the national exam for my university-level, ‘Advanced Placement’ single-variable Calculus class at the end of high school. The score came as a surprise. Suddenly, I realized I could do math. When I picked my classes for my first year of college, I decided I wanted to continue. Linear Algebra was recommended to me, but I decided to take an accelerated Calculus class, meant as a review of high-school-level material.
I was excited. Always interested in science and the environment, I told myself that I should aim for a field that emphasized verbal skills, which I had never questioned. Therefore, I pursued environmental activism, thinking I might do environmental law. But, now that I could see a future for myself in a quantitative field, becoming an ecologist seemed possible.
Unfortunately, I struggled in that Calculus class, receiving one of the worst grades of my college career. Instead of questioning why I wasn’t understanding the material and seeking help with it, I just accepted that maybe I wasn’t good at math after all and didn’t take another class. Yet, when given the opportunity to conduct my own research in my final year, I found that the analytical skills from my literature classes were invaluable and that when presented with a problem, I had the drive to find and learn a quantitative solution.
I’m recounting my life story to hopefully encourage anyone else out there who has been told, or to whom it has been implied, that they are not good at math and therefore cannot do quantitative science. As long as you find the right teachers, the right formats, and learn continually, computational work isn’t that scary.
Statistics, to me, is pretty far from other math classes I’ve ever taken, and is more interesting, providing an immediate answer to the age-old question: “but when am I ever going to use this?” The Highland Statistics course was intense, cramming an unbelievable amount of information into five, full days. The basis of the course was linear mixed effects models (GLMMs): models that include fixed and random effects. For example (since its Halloween when I’m writing this), how can we model the effect of costume choice on the amount of candy received when trick-or-treating?
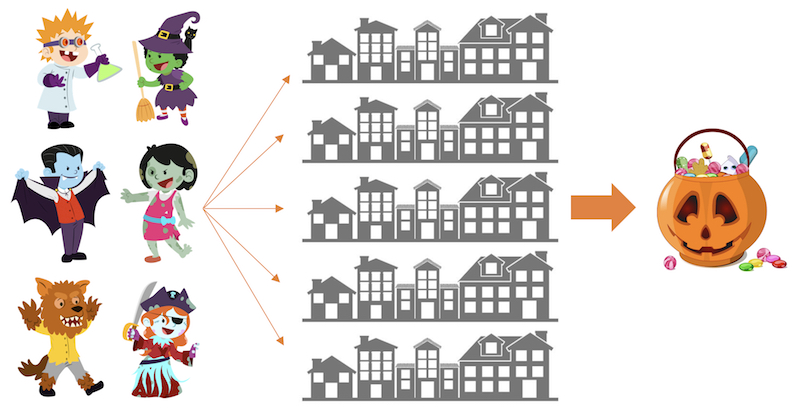
Figure 1: Design of trick-or-treat study.
To answer this question, we can send costumed researchers out to 5 different streets within a neighborhood. Since the data from the whole neighborhood will be analyzed together, we need to include variation between the streets in the model and therefore we will use a mixed effects model. If you just compared the results from the trick-or-treating without considering the difference between the streets, your model outputs could be skewed.
In the course, we ran GLMMs using Poisson, negative binomial, Bernoulli, and gamma distributions. We learned how to run each using Bayesian and frequentist approaches. I don’t think I know yet how useful the course was, as each of these approaches is useful for certain scenarios, certain datasets.
For that reason, each lesson was presented as a R script constructed around the data from a real, published ecological or behavioral study. This format helped ground the material, allowing the course to cover not just the theory behind and implementation of the models, but how studies should be constructed. The statistics didn’t seem as complicated when they answered real questions. The course also reminded me, again, how important the initial design of an experiment is, a skill that I don’t feel I’ve yet conquered. For example, in the trick-or-treat study, you need at least five sites to incorporate random effects–important information to know during study design.
I don’t have an immediate application for GLMMs, but as someone who is largely self-taught, the formal explanations of the models and distributions were invaluable. I also thoroughly enjoyed the Bayesian part of the course. Those sections were less confusing to me, maybe because the models were simpler, or because, due to my lack of formal training, I haven’t been fully inculcated in frequentist methods and was able to adjust my thinking more readily.
There are no p-values in Bayesian stats. Instead, with a Bayesian model, you can say there is (or isn’t) a 95% chance that a parameter is between two values. Another benefit of Bayesian statistics is that you can incorporate prior knowledge of a system into your models. For the trick-or-treating study, you might already have an idea of how the candy haul varies by time of day. These properties give Bayesian statistics an edge when dealing with uncertain systems, but can be a difficult mental switch from traditional, frequentist stats. I bought myself a book so I can continue exploring.
If you have the chance to attend one of the Highland Statistics courses, I’d recommend it. They’re pricey, but take place in some pretty cool destinations in Europe and North America. You can check their upcoming courses here.
In general, I’d recommend learning statistics with an open mind. Leave all preconceptions of your own ability behind so you can either surprise yourself or not fall victim to hubris. It can help to have an application for a model in mind, but I’d also recommend starting before you have an entire study designed.
Happy statisticsing!
P.S. Thank you so so much to EuroMarine for the funding to attend this course. It was invaluable and I will endeavor to share all I learned with everyone at my institution and beyond.